Nova Analytics
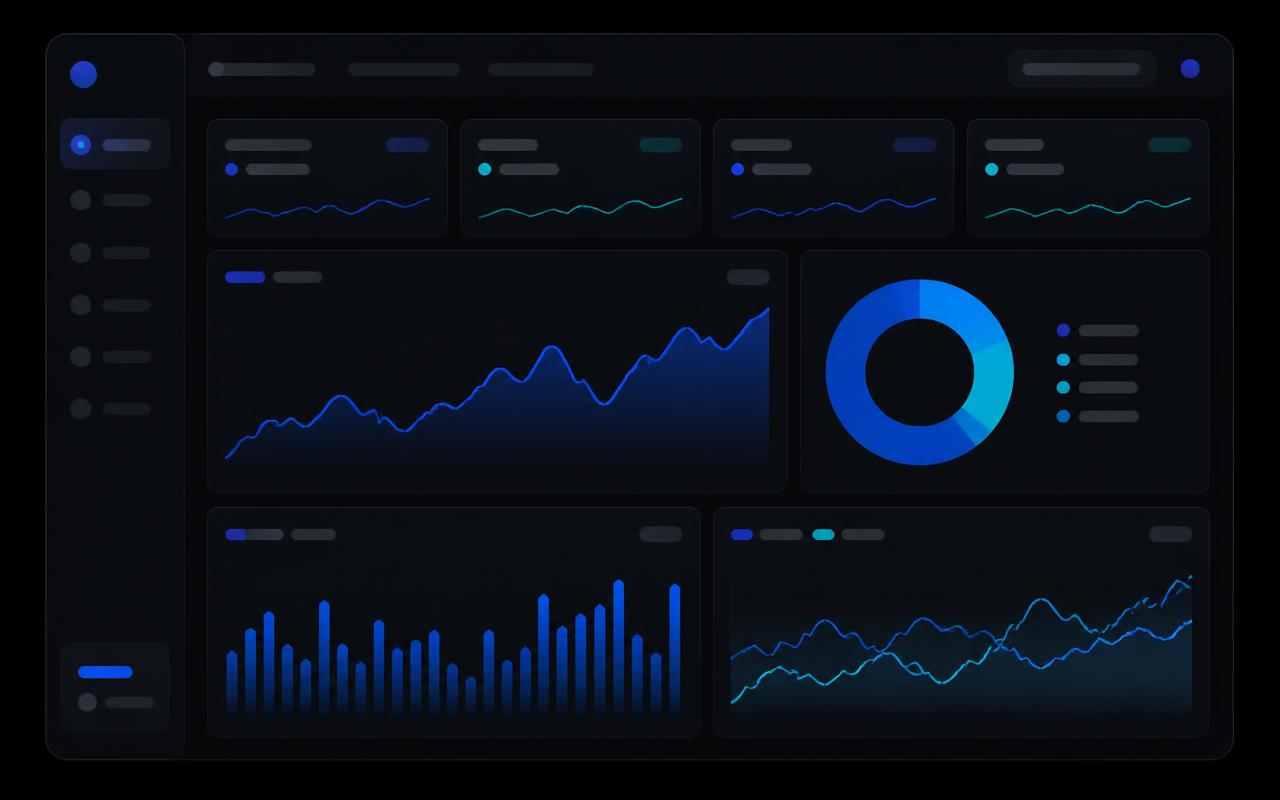
Dark, data-heavy dashboard for a SaaS product.
- Role
- Design and build
- Timeline
- 3 weeks
- Stack
- Next.js · Recharts · Tailwind
The problem
Their old dashboard buried the numbers people actually opened it for. Support kept getting the same question: where do I see today's revenue?
What I built
- A single overview screen that answers the three questions users log in for
- A chart system with shared colours, tooltips and empty states so nothing looks broken on day one
- Dark-first design with a readable contrast pass on every chart label
- Table virtualisation so a 50k-row export view still scrolls smoothly
How it turned out
Support tickets about finding basic metrics dropped off, and the overview became the page people leave open all day.